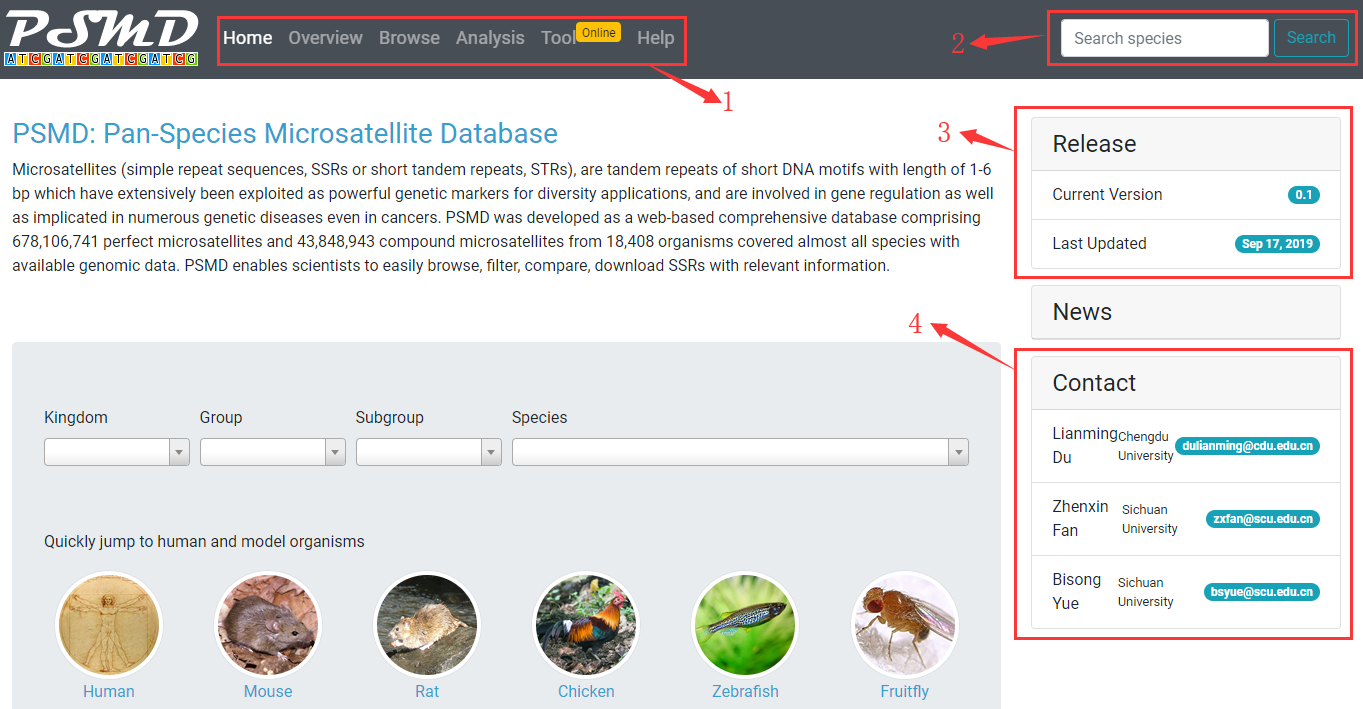
1. Home: go to homepage. Overview: go to view and download statistics. Browse: go to view, filter and download microsatellites. Analysis: go to compare microsatellite distribution between several species. Tool: go to search microsatellites with custom parameters. Help: go to view documentation.
2. Go to search a species by scientific name, common name, NCBI taxonomy ID, Genbank assembly accession.
4. Current version and latest update time.
5. Contact information
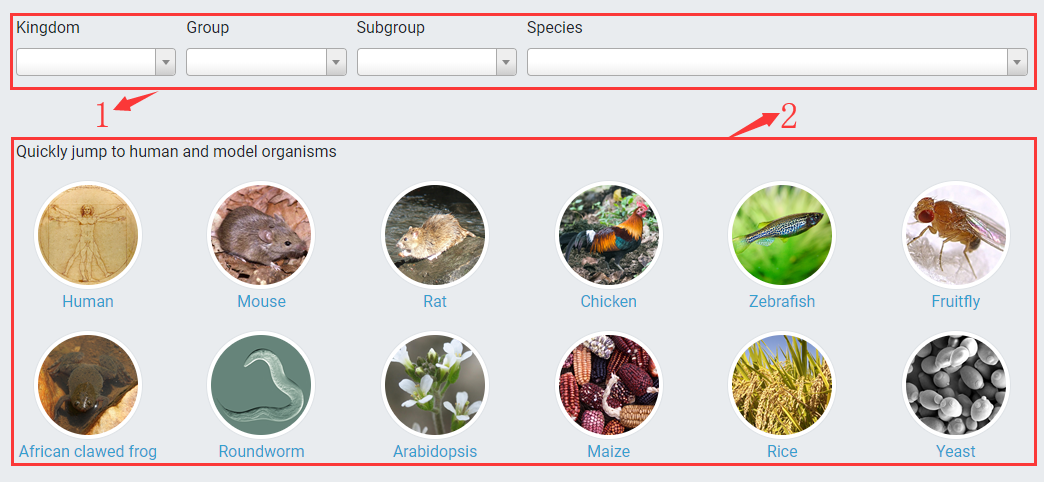
1. You can select or search a species for quick access by specifying kingdom, group, subgroup and species name.
2. You also can click on image links to directly redirect to human or model organisms.
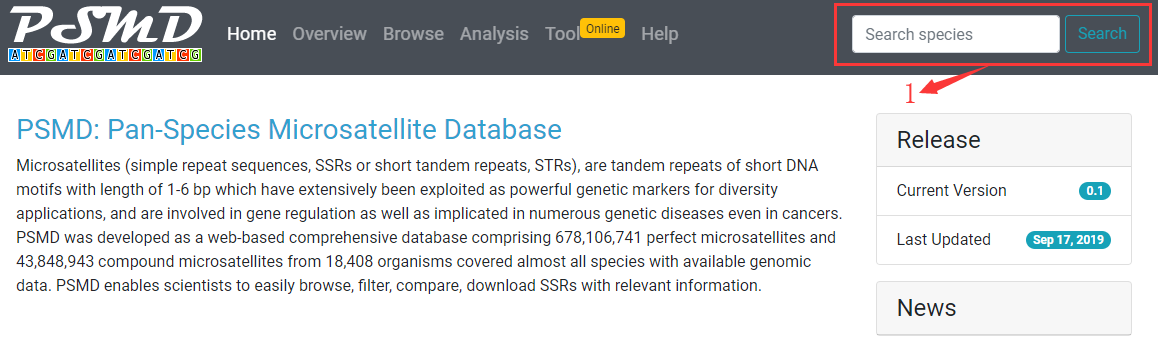
1. PSMD allows you to search a species by typing species name, common name, NCBI taxonomy ID, genbank assembly accession, refseq assembly accession, biosample accession, or bioproject accession.
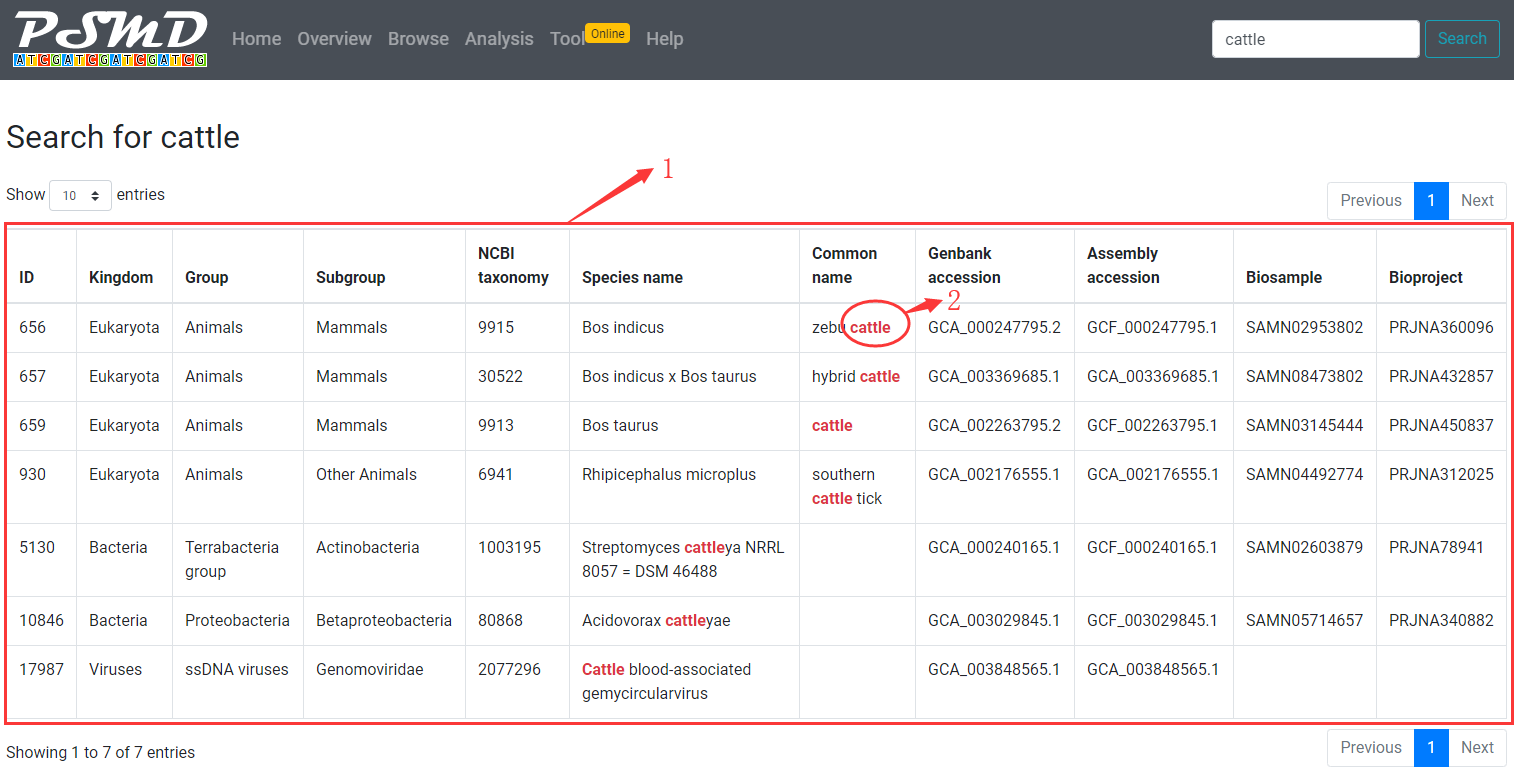
1. A table with search results will be displayed. click on a row to quickly access to microsatellite summary information page of species.
2. The searched term will be highlighted in table.
PSMD allows you to browse statistical information of all species.
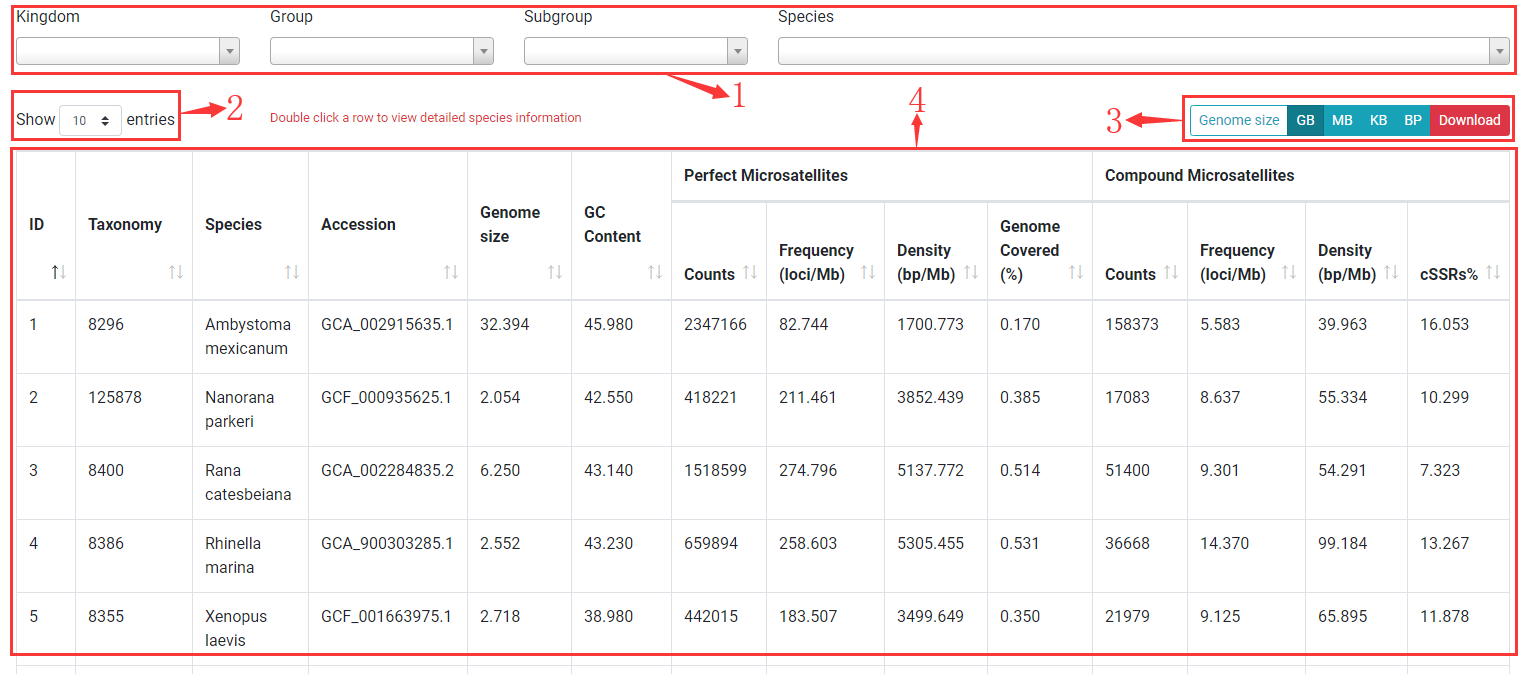
1. You can use dropdown menus to limit results to a kingdom, group, subgroup or a species.
2. Change number of rows in result table to 10, 25, 50, 100.
3. You can change the unit of genome size to GB, MB, KB, BP and open download dialog by clicking Download button.
4. A result table for displaying statistical summary information. Double click on a row to view detailed species information. Taxonomy: NCBI taxonomy ID; Species: Species name; Accession: NCBI assembly accession number; Genome size: genome size of speices can be changed by clicking unit buttons; GC content: Percentage of GC in genome; Counts: number of SSRs or compound SSRs; Frequency: number of loci per MB genome (loci/Mb); Density: length of SSRs per MB genome (bp/Mb); Genome covered: Percentage of genome covered by SSRs; cSSRs%: Percentage of individual SSRs being part of a compound SSRs.

By clicking on download button, you can open download dialog.
1. Download statistical information as CSV (Comma-Separated Values) or TSV (Tab-Separated Values) file.
2. Select statistical content to download. Overview statistics: contents displayed in table; SSR type statistics: statistics for each SSR type (Mono- to Hexa-); Motif statistics: statistics for 501 standard motifs; Coding SSRs statistics: statistics for SSRs in coding regions.
3. Select output data type. SSR counts, length, frequency (loci/Mb) or density (bp/Mb).
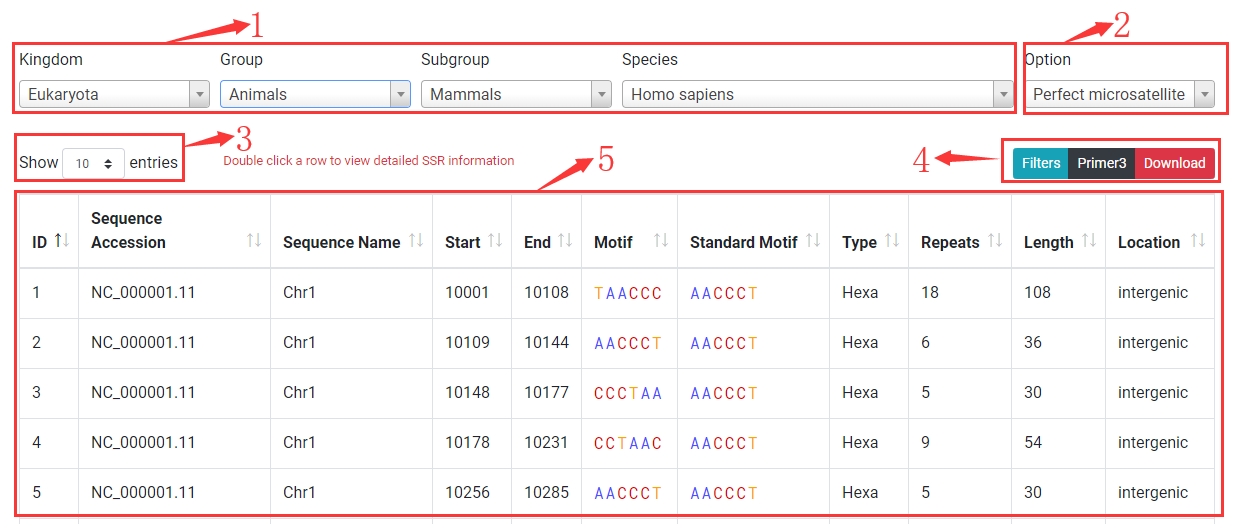
The browse page list all SSRs identified from a species.
1. You select or search a species to browse by specifying kingom, group, subgroup and species.
2. The default displaying SSRs are perfect. Option allows you to switch to browse compound SSRs or redirect to summary information page of species.
3. Change number of rows displayed in table to 10, 25, 50, 100.
4. Buttons for opening filter dialog (Filters), primer3 setting dialog (Primer3), download dialog (Download)
5. A table to show SSRs. Click on table to sort SSRs. Sequence Accession: accession number of sequence where SSR located; Sequence Name: name of sequence where SSR located; Start: start position of SSR (1-based); End: end position of SSR; Motif: motif sequence of SSR; Standard Motif: standard motif by grouping cyclically equivalent and reverse complementary permutations; Type: SSR type (Mono-, Di-, Tri-, Tetra-, Penta-, Hexa-nucleotide); Repeats: number of repeat period; Length: total base of SSR; Location: genic location (CDS, intron, exon, or intergenic).
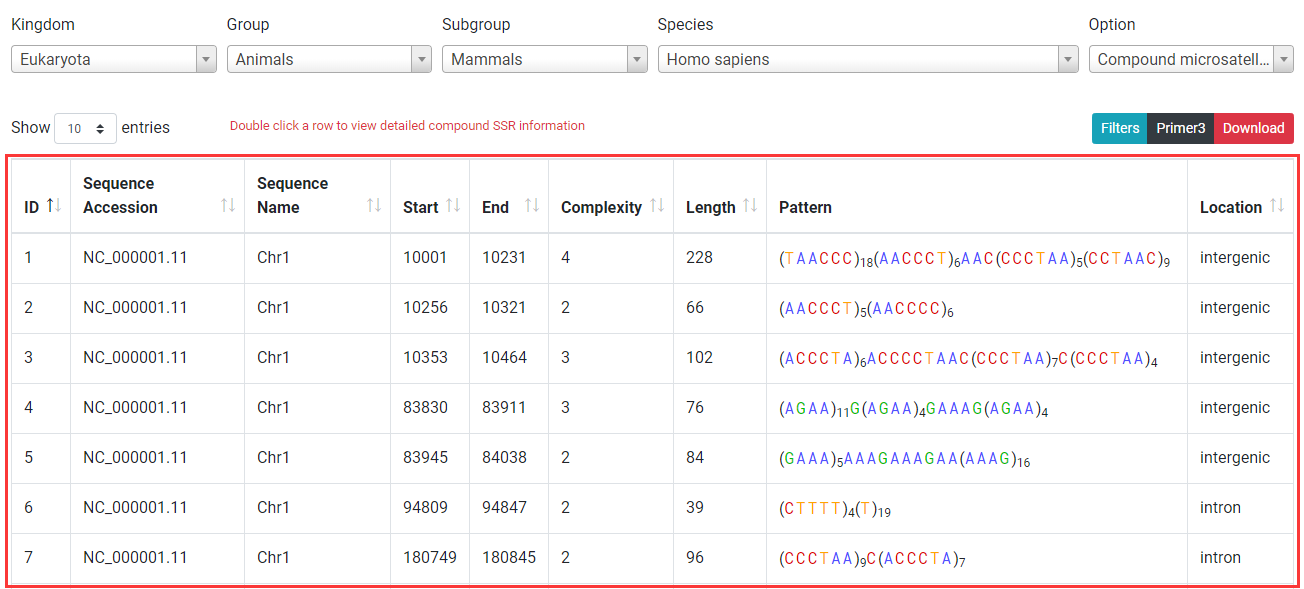
Compound SSR browsing is similar to perfect SSR browsing. Among columns, Complexity: number of individual SSRs in a compound SSR; Pattern: sequence composition of compound SSRs.
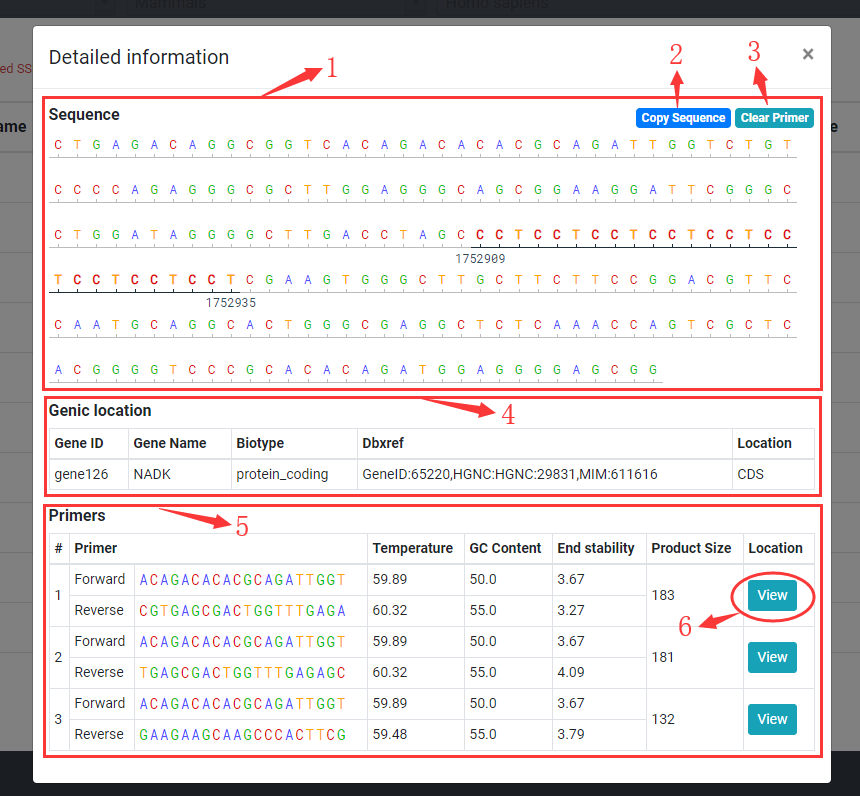
Double click on a row in table to display detailed SSR information.
1. Displaying SSR sequence with 100 bp flanking sequence.
2. Click copy sequence button to copy the sequence displayed.
3. Click clear primer button to clear the location of primer.
4. If SSR located in gene, the detailed gene information will be displayed.
5. If primer of SSR designed successfully, the detailed primers information will be displayed.
6. Click view button to check the primer location in sequence box.
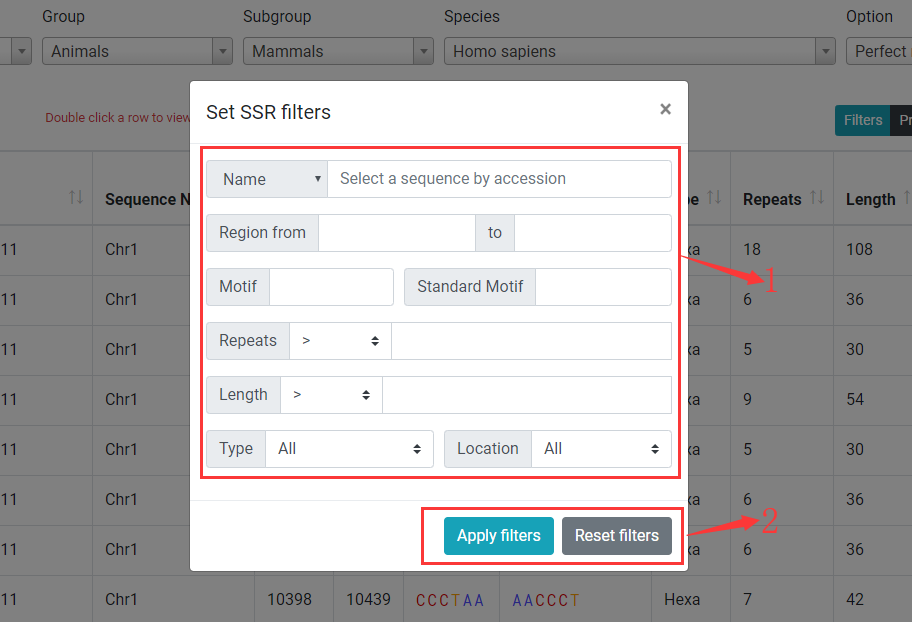
Click on Filters button to open SSR filter dialog.
1. You can filter SSRs in table by setting filters for each column in table.
2. Click on Apply filters button to applay filters and click on Reset filters to clear filters.
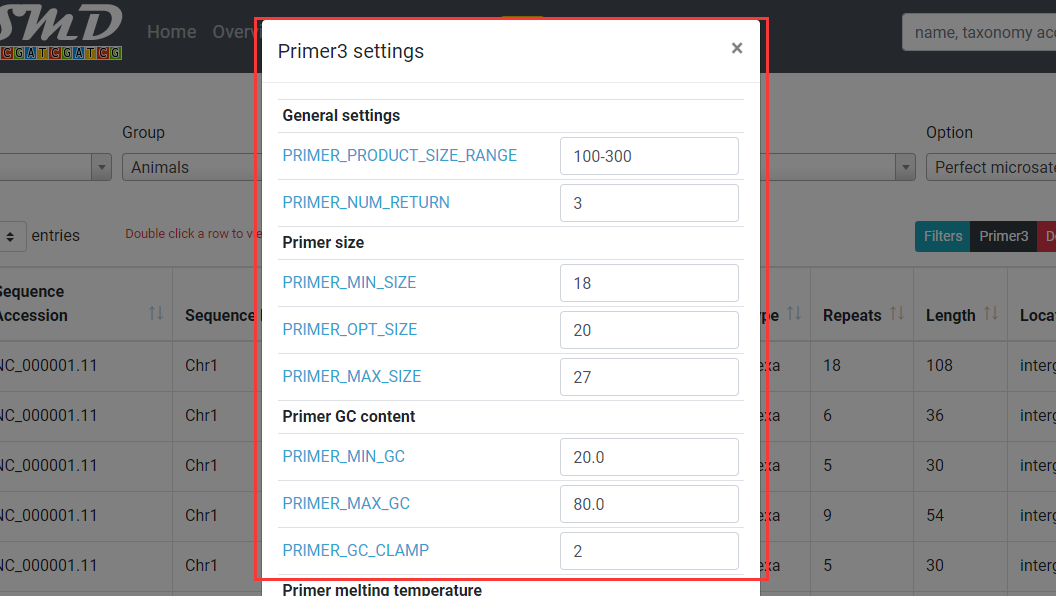
Click on "Primer3" button to open primer3 setting dialog. You can specify the parameters for primer3 which affects the primers displayed in SSR detailed information dialog.
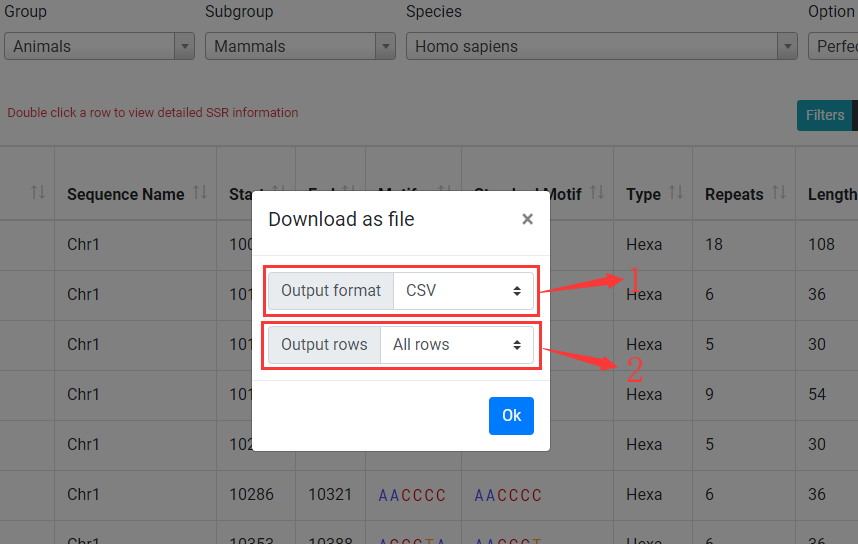
Click on "Download" button to open download dialog.
1. Download SSRs as CSV, TSV or GFF formatted file.
2. You can select output SSRs (All rows in table or filtered rows in table).
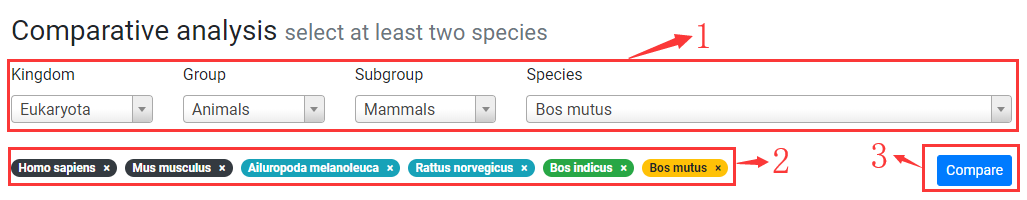
1. You can search and add a species to compare by specifying kingdom, group, subgroup and species.
2. Selected species to compare. Click on "x" to remove corresponding species.
3. Click on "Compare" button to generate comparative plots.
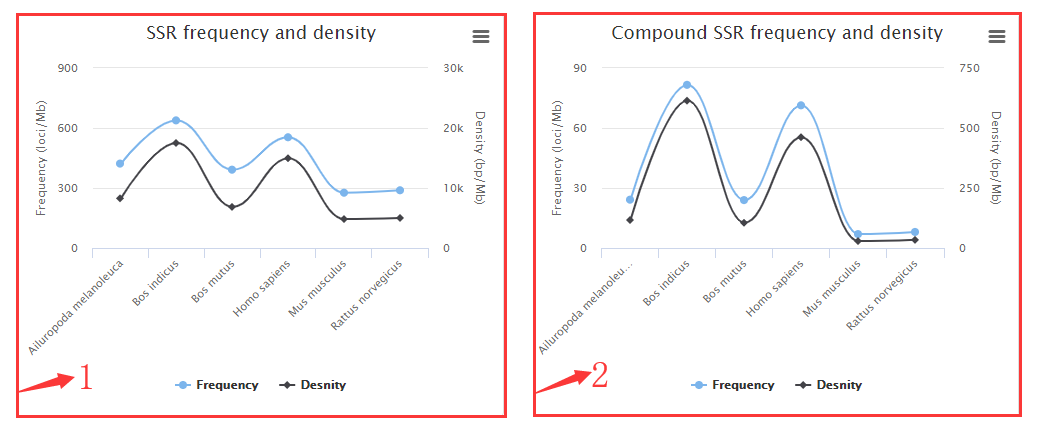
1. Perfect SSRs frequency (loci/Mb) and density (bp/Mb) plots.
2. Compound SSRs frequency (loci/Mb) and density (bp/Mb) plots.
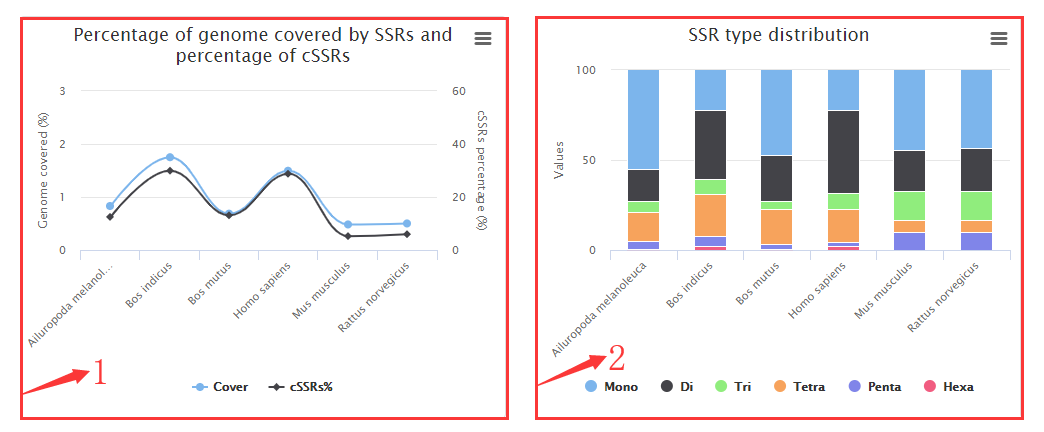
1. Percentage of genome covered by SSRs (%) and Percentage of individual SSRs being part of a compound SSRs (cSSRs%) plots.
2. SSRs types (Mono-, Di-, Tri-, Tetra-, Penta-, Hexa-) distribution plot.
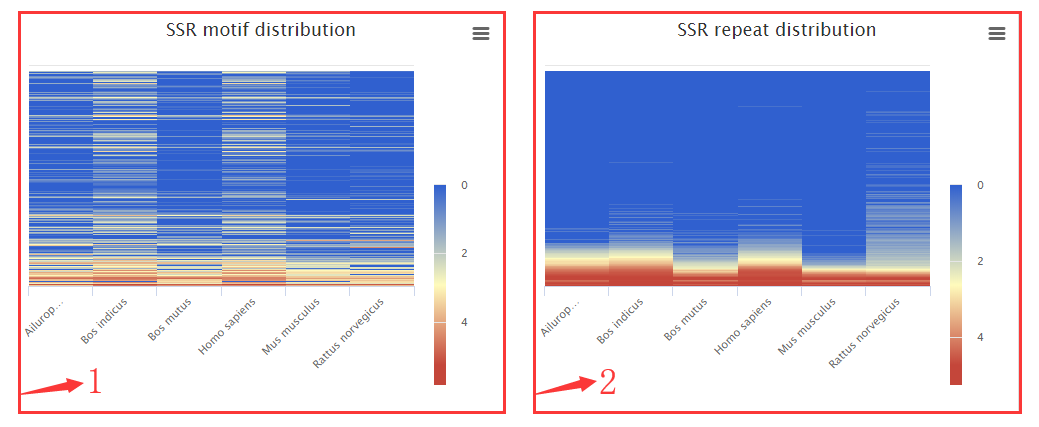
1. Heatmap for abundance of standard 501 motifs.
2. Heatmap for abundance of each repeat.
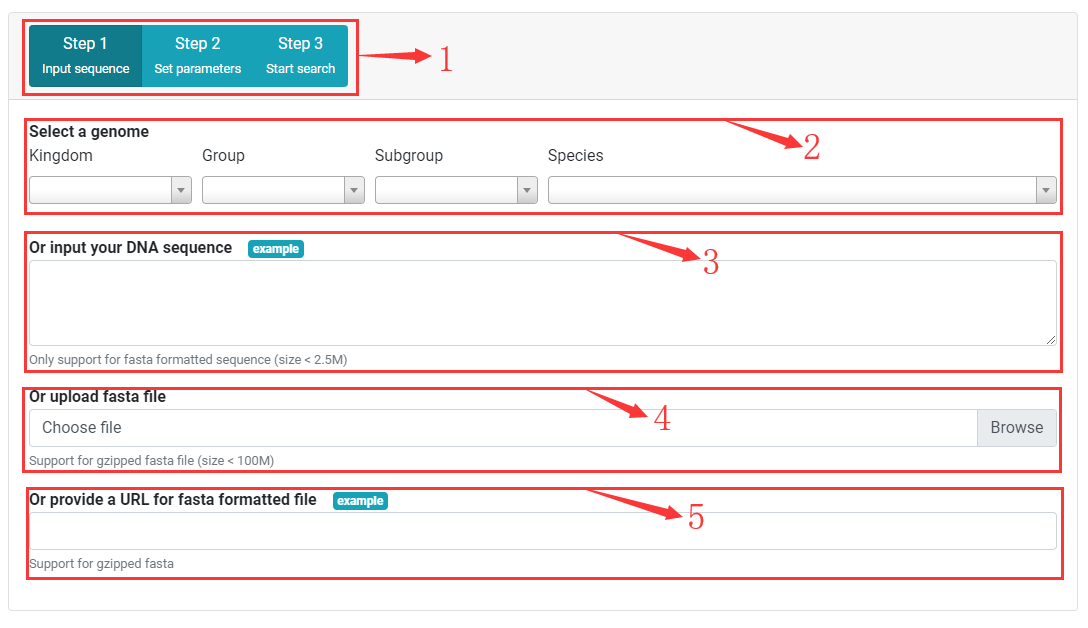
Step One Input DNA sequences
1. Buttons for switching to step one, two or three.
2. Select or search a genome in PSMD database for SSR detection by specifying kingdom, group, subgroup and species.
3. Input or paste FASTA formatted DNA sequence for SSR detection. Sequence size must < 2.5M.
4. Upload a flat text or gzipped FASTA formatted file for SSR detection. File size must < 100 M.
5. Input a URL of FASTA formatted file to download and search for SSRs. No file size limited.
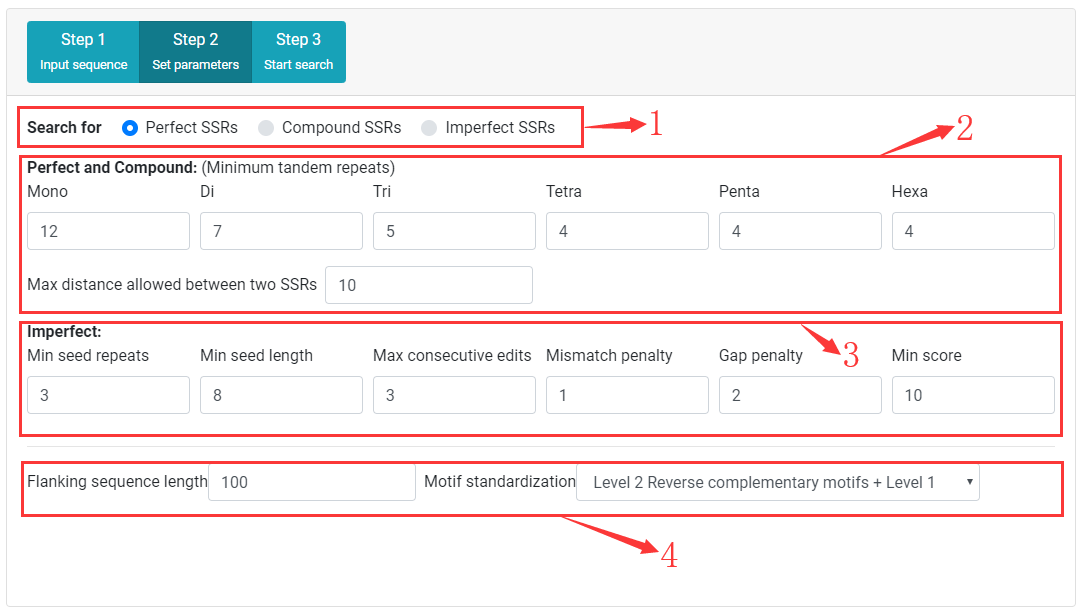
Step Two Set search parameters
1. Select SSR type (perfect, compound, or imperfect) for search
2. Set mimimum tandem repeats for perfect SSR detection, and Maximum distance (dmax) allowed between any two adjacent SSRs forming a compound SSR for compound SSR detection.
3. Set imperfect SSR search parameters.
4. Set length of flanking sequence, and motif standardization level.
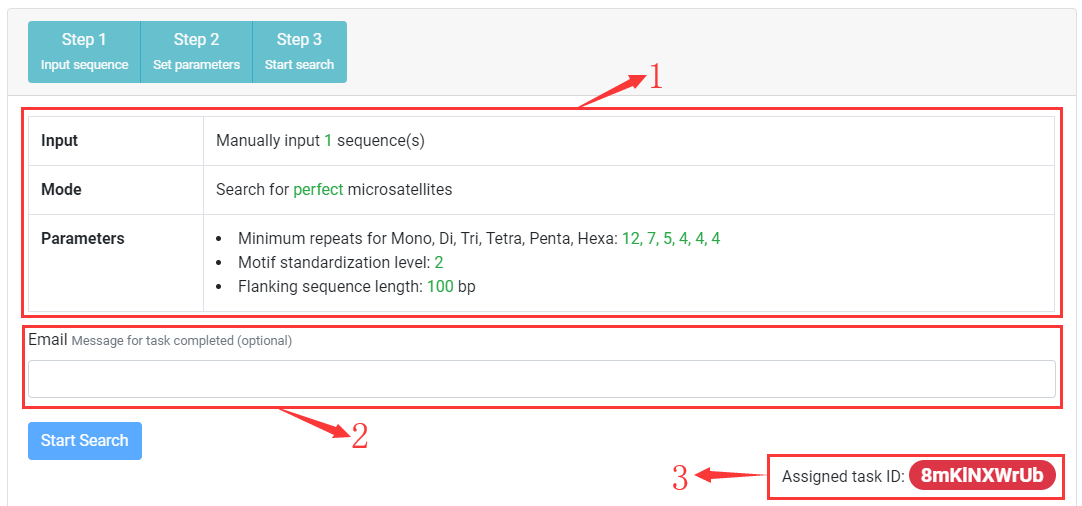
Step Three Submit task
1. Check input validation and display relevant information.
2. You can input an email address. After task completed, a hypelink used to view task result will be sent to you.
3. After task submitted, a unique task ID will be assigned, click on task ID to check task status and view results.
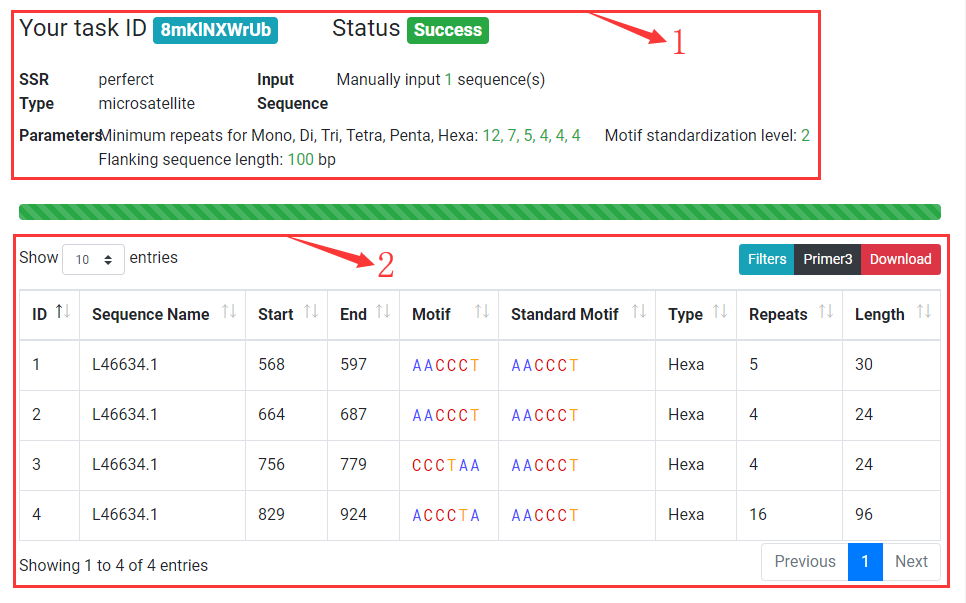
Task Results
1. Display task status and running paramters.
2. Display SSRs identified from input sequences. You can browse, filter and download results. Double click on a row to display detailed SSR information with primers.